
How Downtowns Are Starting to Tell the Impact Story (Even When the Numbers Don’t Fully Add Up Yet)
Table of contents
If you work in a downtown district, you probably already know this feeling. You’ve just wrapped up an event, you pull together the numbers, attendance looks solid, foot traffic is up, everything seems like it went well, and then someone asks you what the actual impact was.
And that is usually where things get a little uncomfortable, not because there was no impact, but because it is surprisingly hard to explain it in a way that feels clear and complete. That is really what this conversation is about.
- Local Success Stories
- Tailored Use Cases
- Integration & Migration Synergies
Why This Question Is Getting Harder to Answer
Across districts, the question around ROI is coming up more often and in a much more direct way. People want to understand what changed because of an event, what value it created, and whether it actually made a difference beyond just bringing people in for a few hours.
Most teams already have a good handle on the basics. They can tell you how many people showed up, how busy the area was, and how things performed online.
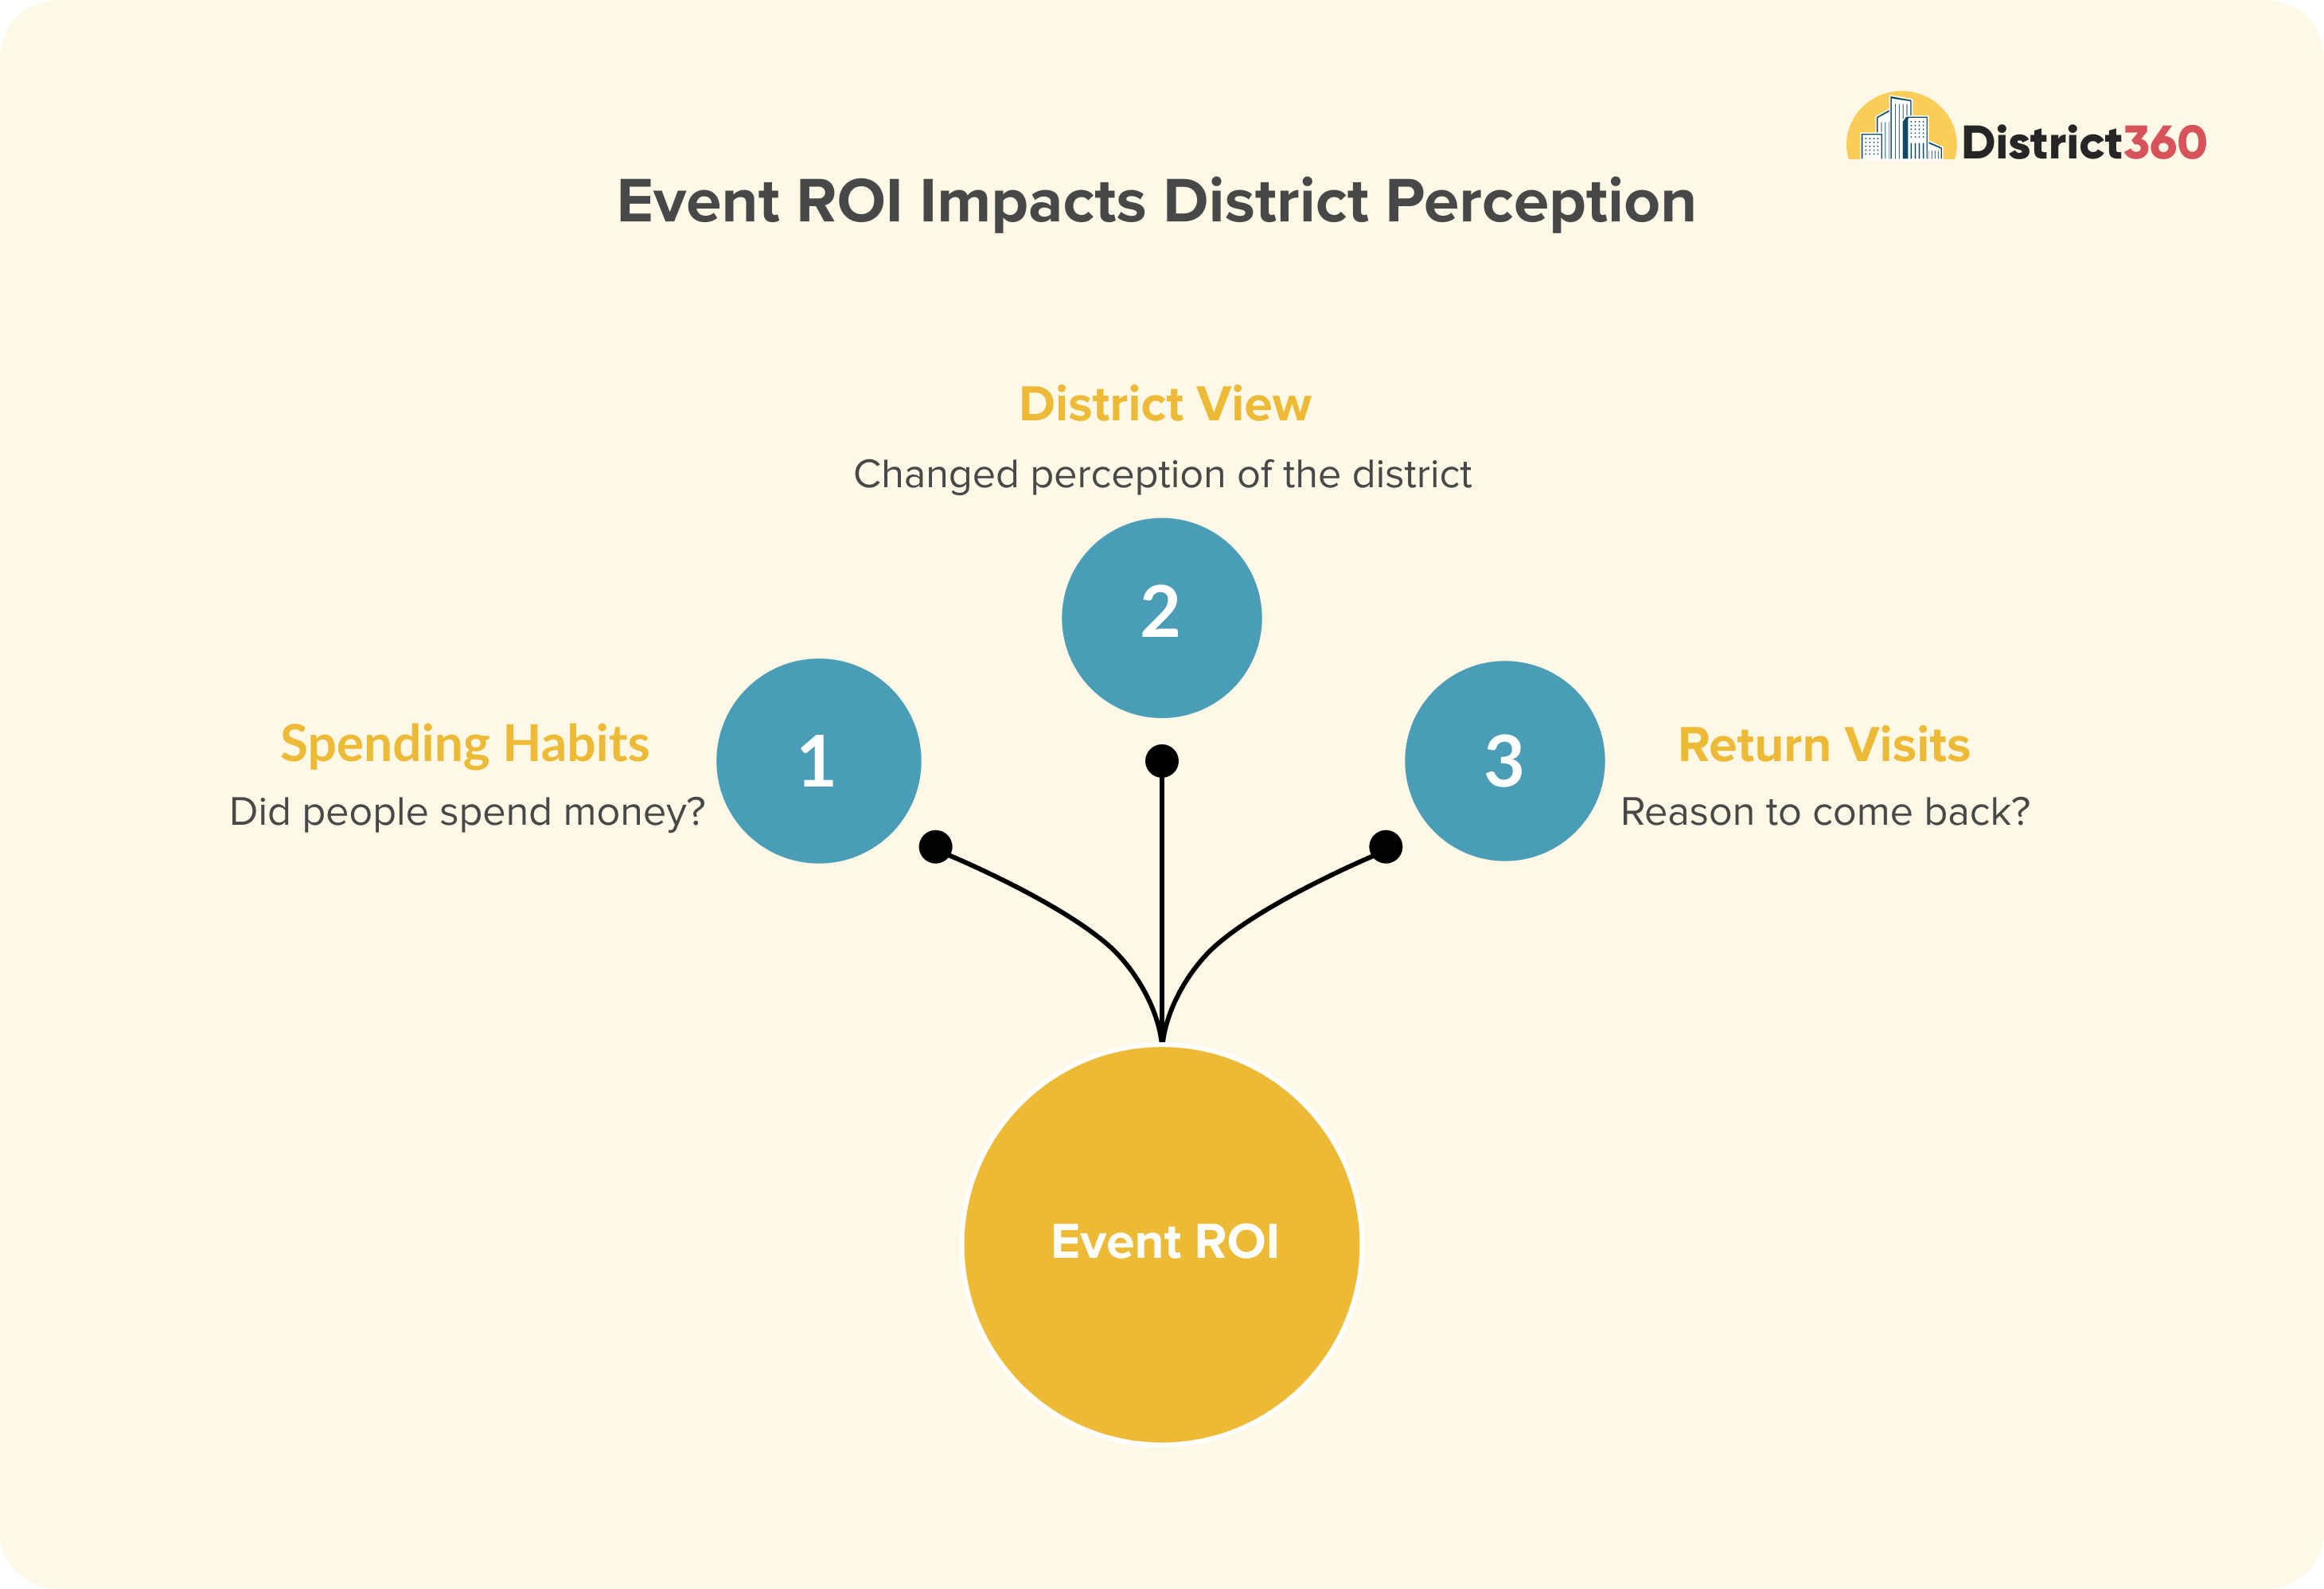
But that only takes you so far because once you move past that, you start getting into questions that are a lot harder to answer. Did people actually spend money? Were they already planning to be there anyway? Did the event change how they see the district? Did it give them a reason to come back?
A lot of this comes back to how people experience a place, whether they feel comfortable, whether they feel like they belong, and what they take away from it.
And there isn’t always a clean way to measure that.
Where Most Teams Are Right Now
One of the things that came up in this session, and it was said pretty openly, is that most districts are still figuring this out.
Some teams feel like they can partially quantify impact, some have a more defined approach, but a lot of people are somewhere in between, where they have numbers, but those numbers do not fully answer the question they are being asked.
And that gap between what we can measure and what we actually want to understand is where most of the work is happening right now.

The Limits of a Single Number
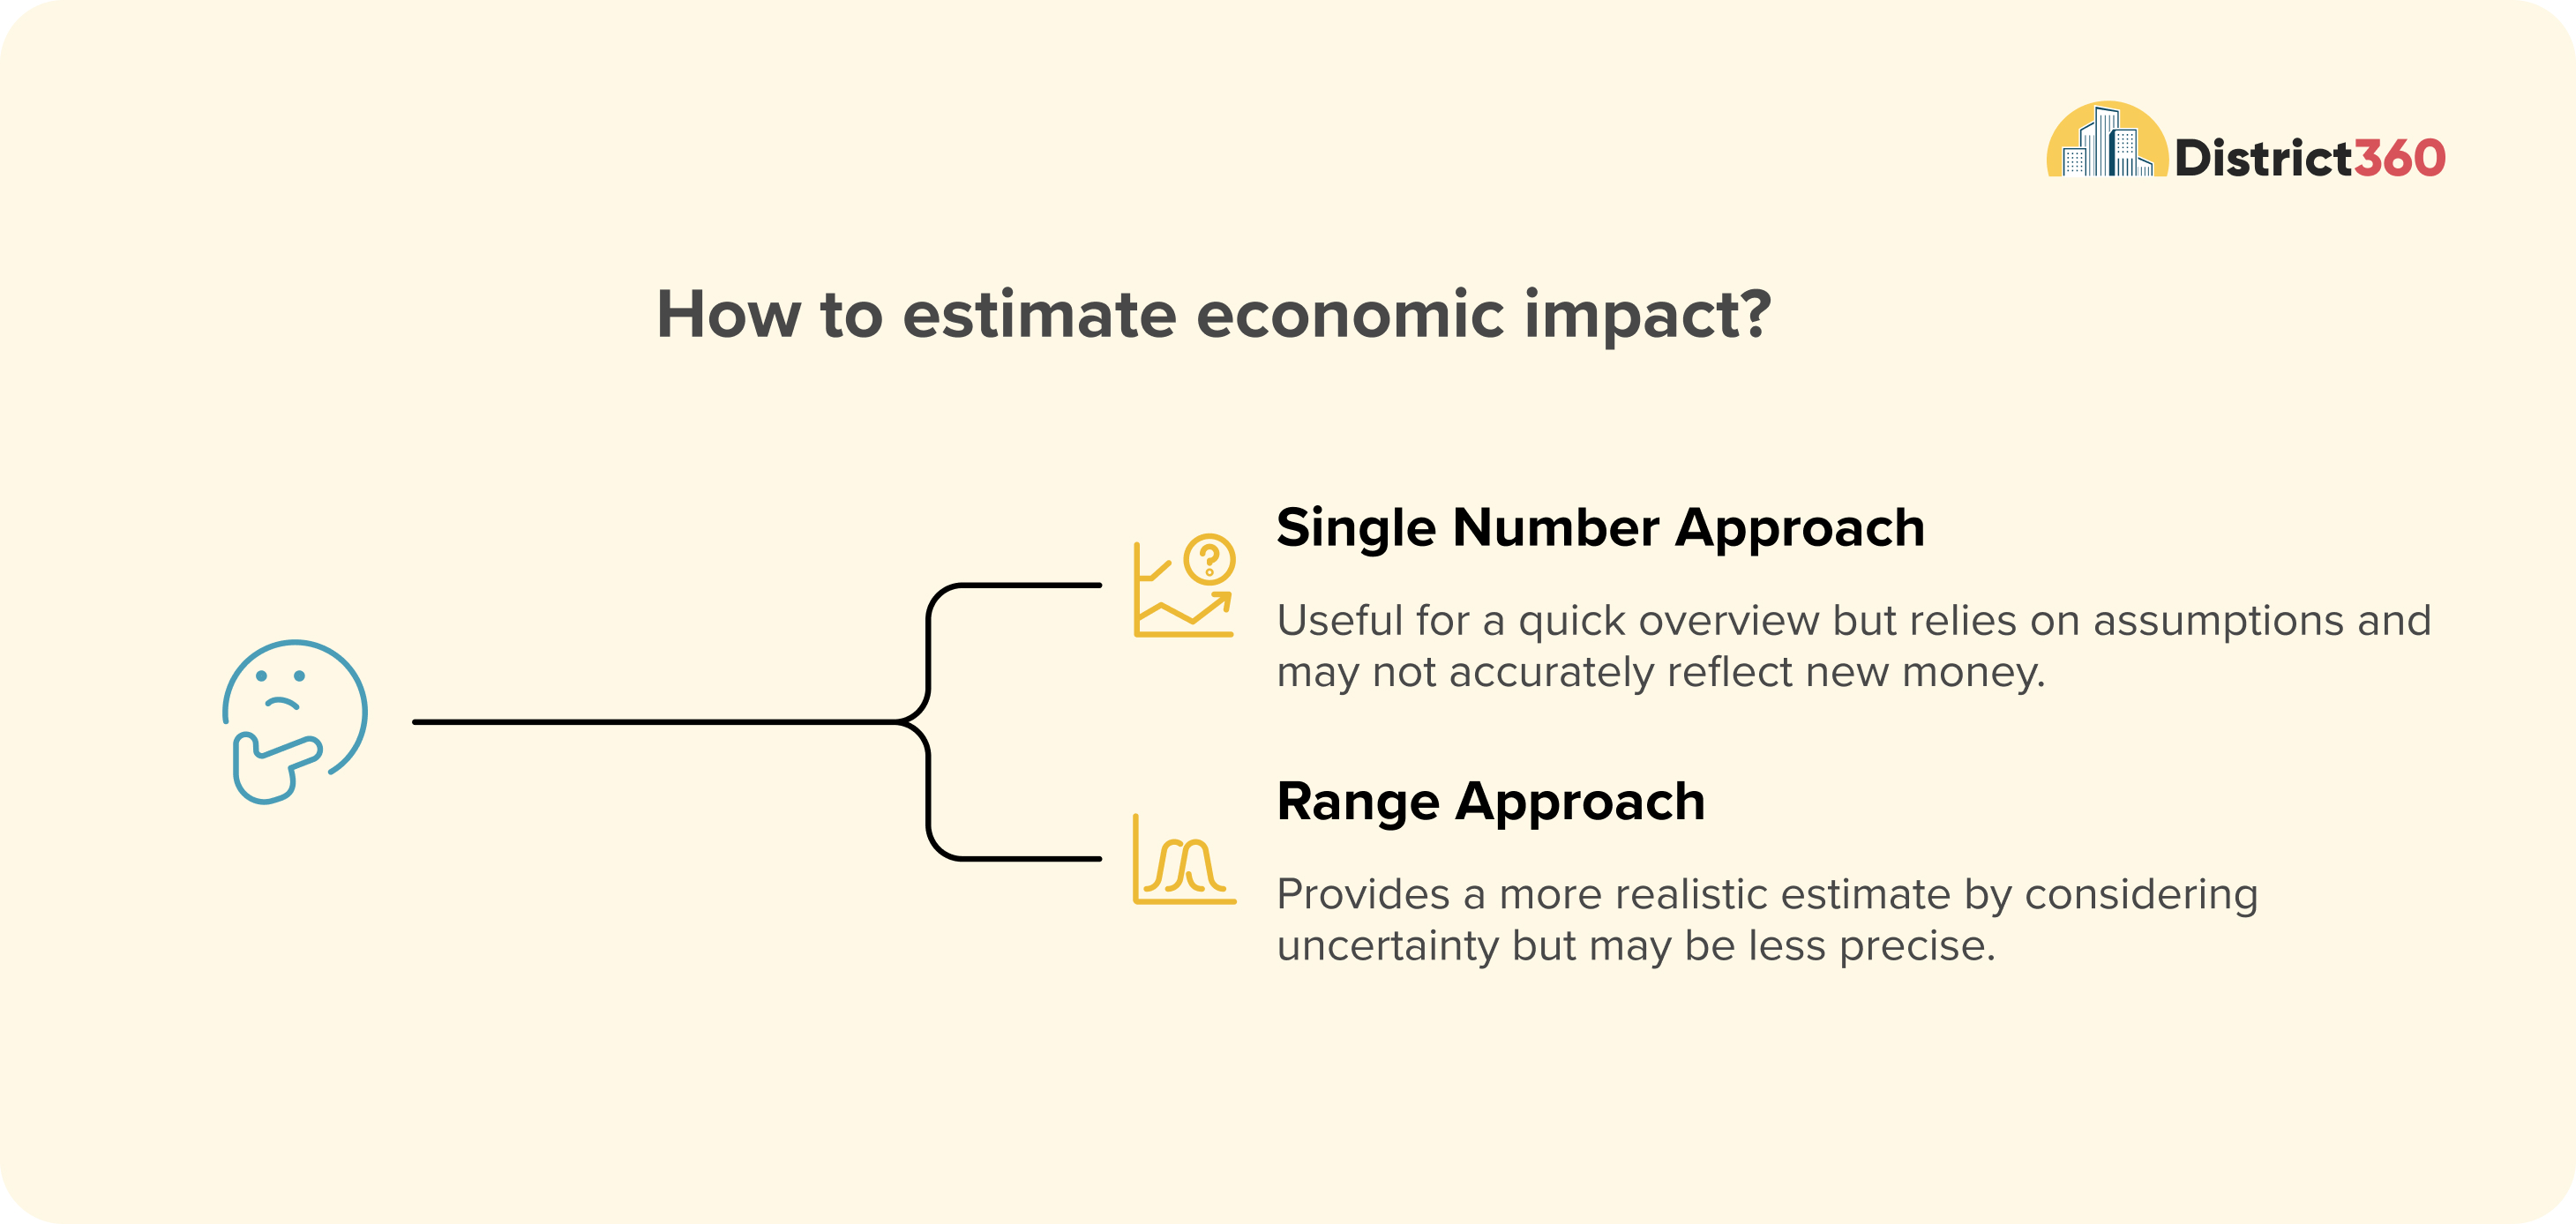
A lot of the current approach to economic impact is fairly familiar. You look at how many people attended, you ask them how much they spent, and then you use that to estimate total impact. It is useful, and it gives you something to work with, but it also comes with a lot of assumptions.
People are estimating their own spending, which is not always accurate, and it does not always separate out who is actually bringing new money into the district versus people who were already there.
And then at the end of all of that, you are left with a single number that looks very precise, even though there is quite a bit of uncertainty behind it.
Why Some Teams Are Moving to a Range
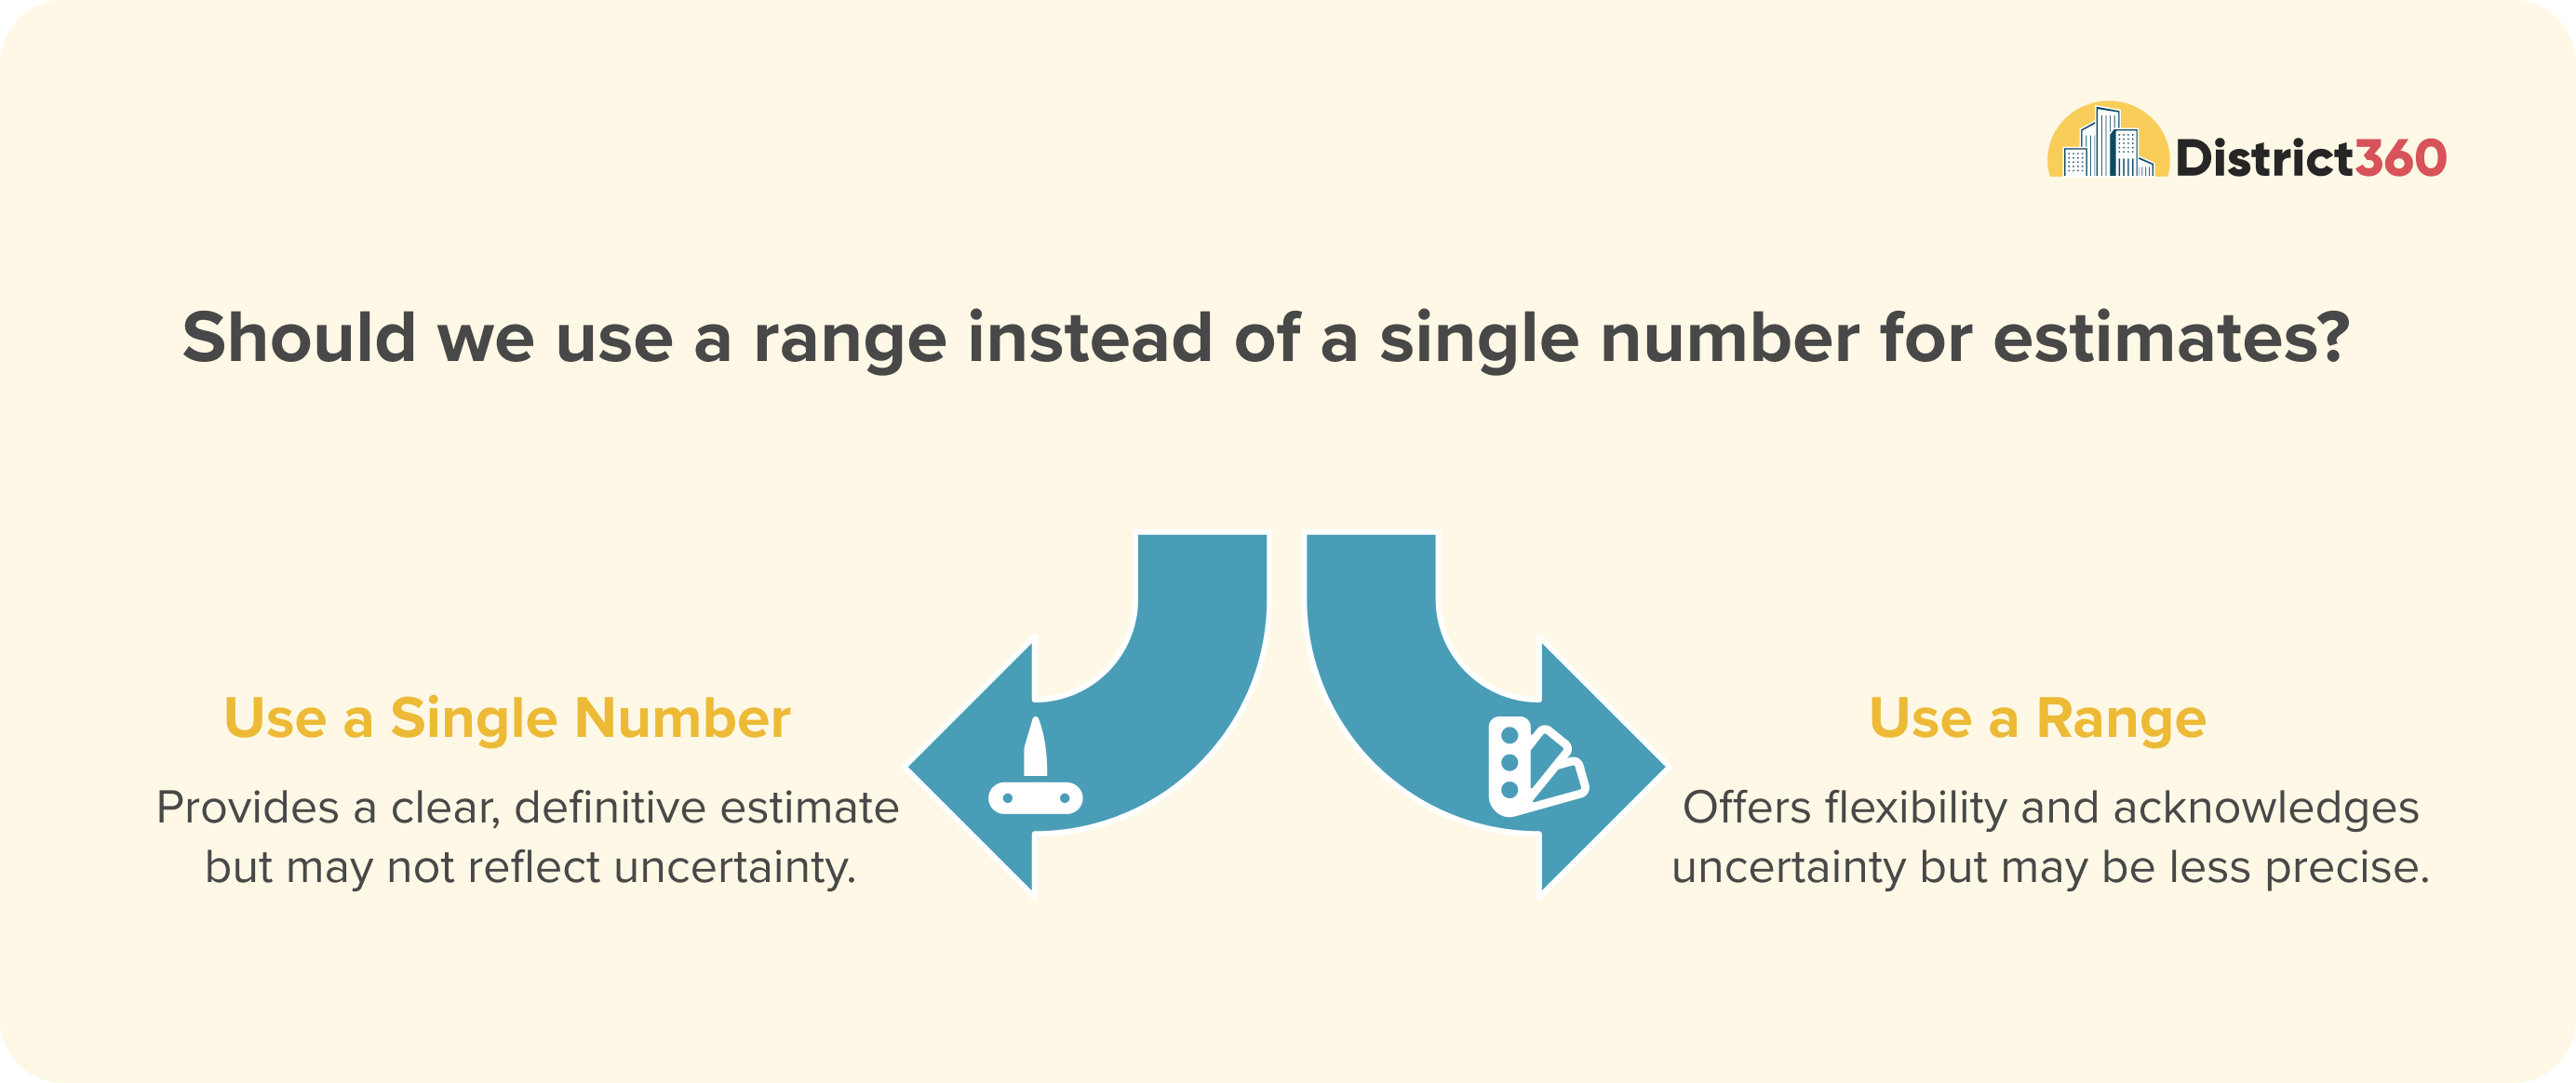
What was interesting in this session was how some teams are starting to move away from that idea of having one definitive number and instead are sharing a range.
It gives you room to say, " This is the more conservative estimate, " " This is the higher end, and here is what those numbers are based on, especially when you start thinking about visitor spending versus local spending and what actually counts as new value for the district
It also makes conversations with stakeholders a little easier, because you are not presenting something as exact when it really is not.
Why Context Changes Everything
Another thing that kept coming up is how much context matters when you are talking about any of these numbers. Because numbers on their own can be misleading if you do not explain what was happening around them.
Something as simple as the weather can change everything. Timing matters. Budget matters. What else was happening in the city matters. So when people are looking at results, they are not just looking at the number; they are trying to understand what that number actually means.
That is where things like year-over-year comparisons start to help. Not as a perfect benchmark, but as a way to make sense of what you are seeing.

Looking at More Than One Signal
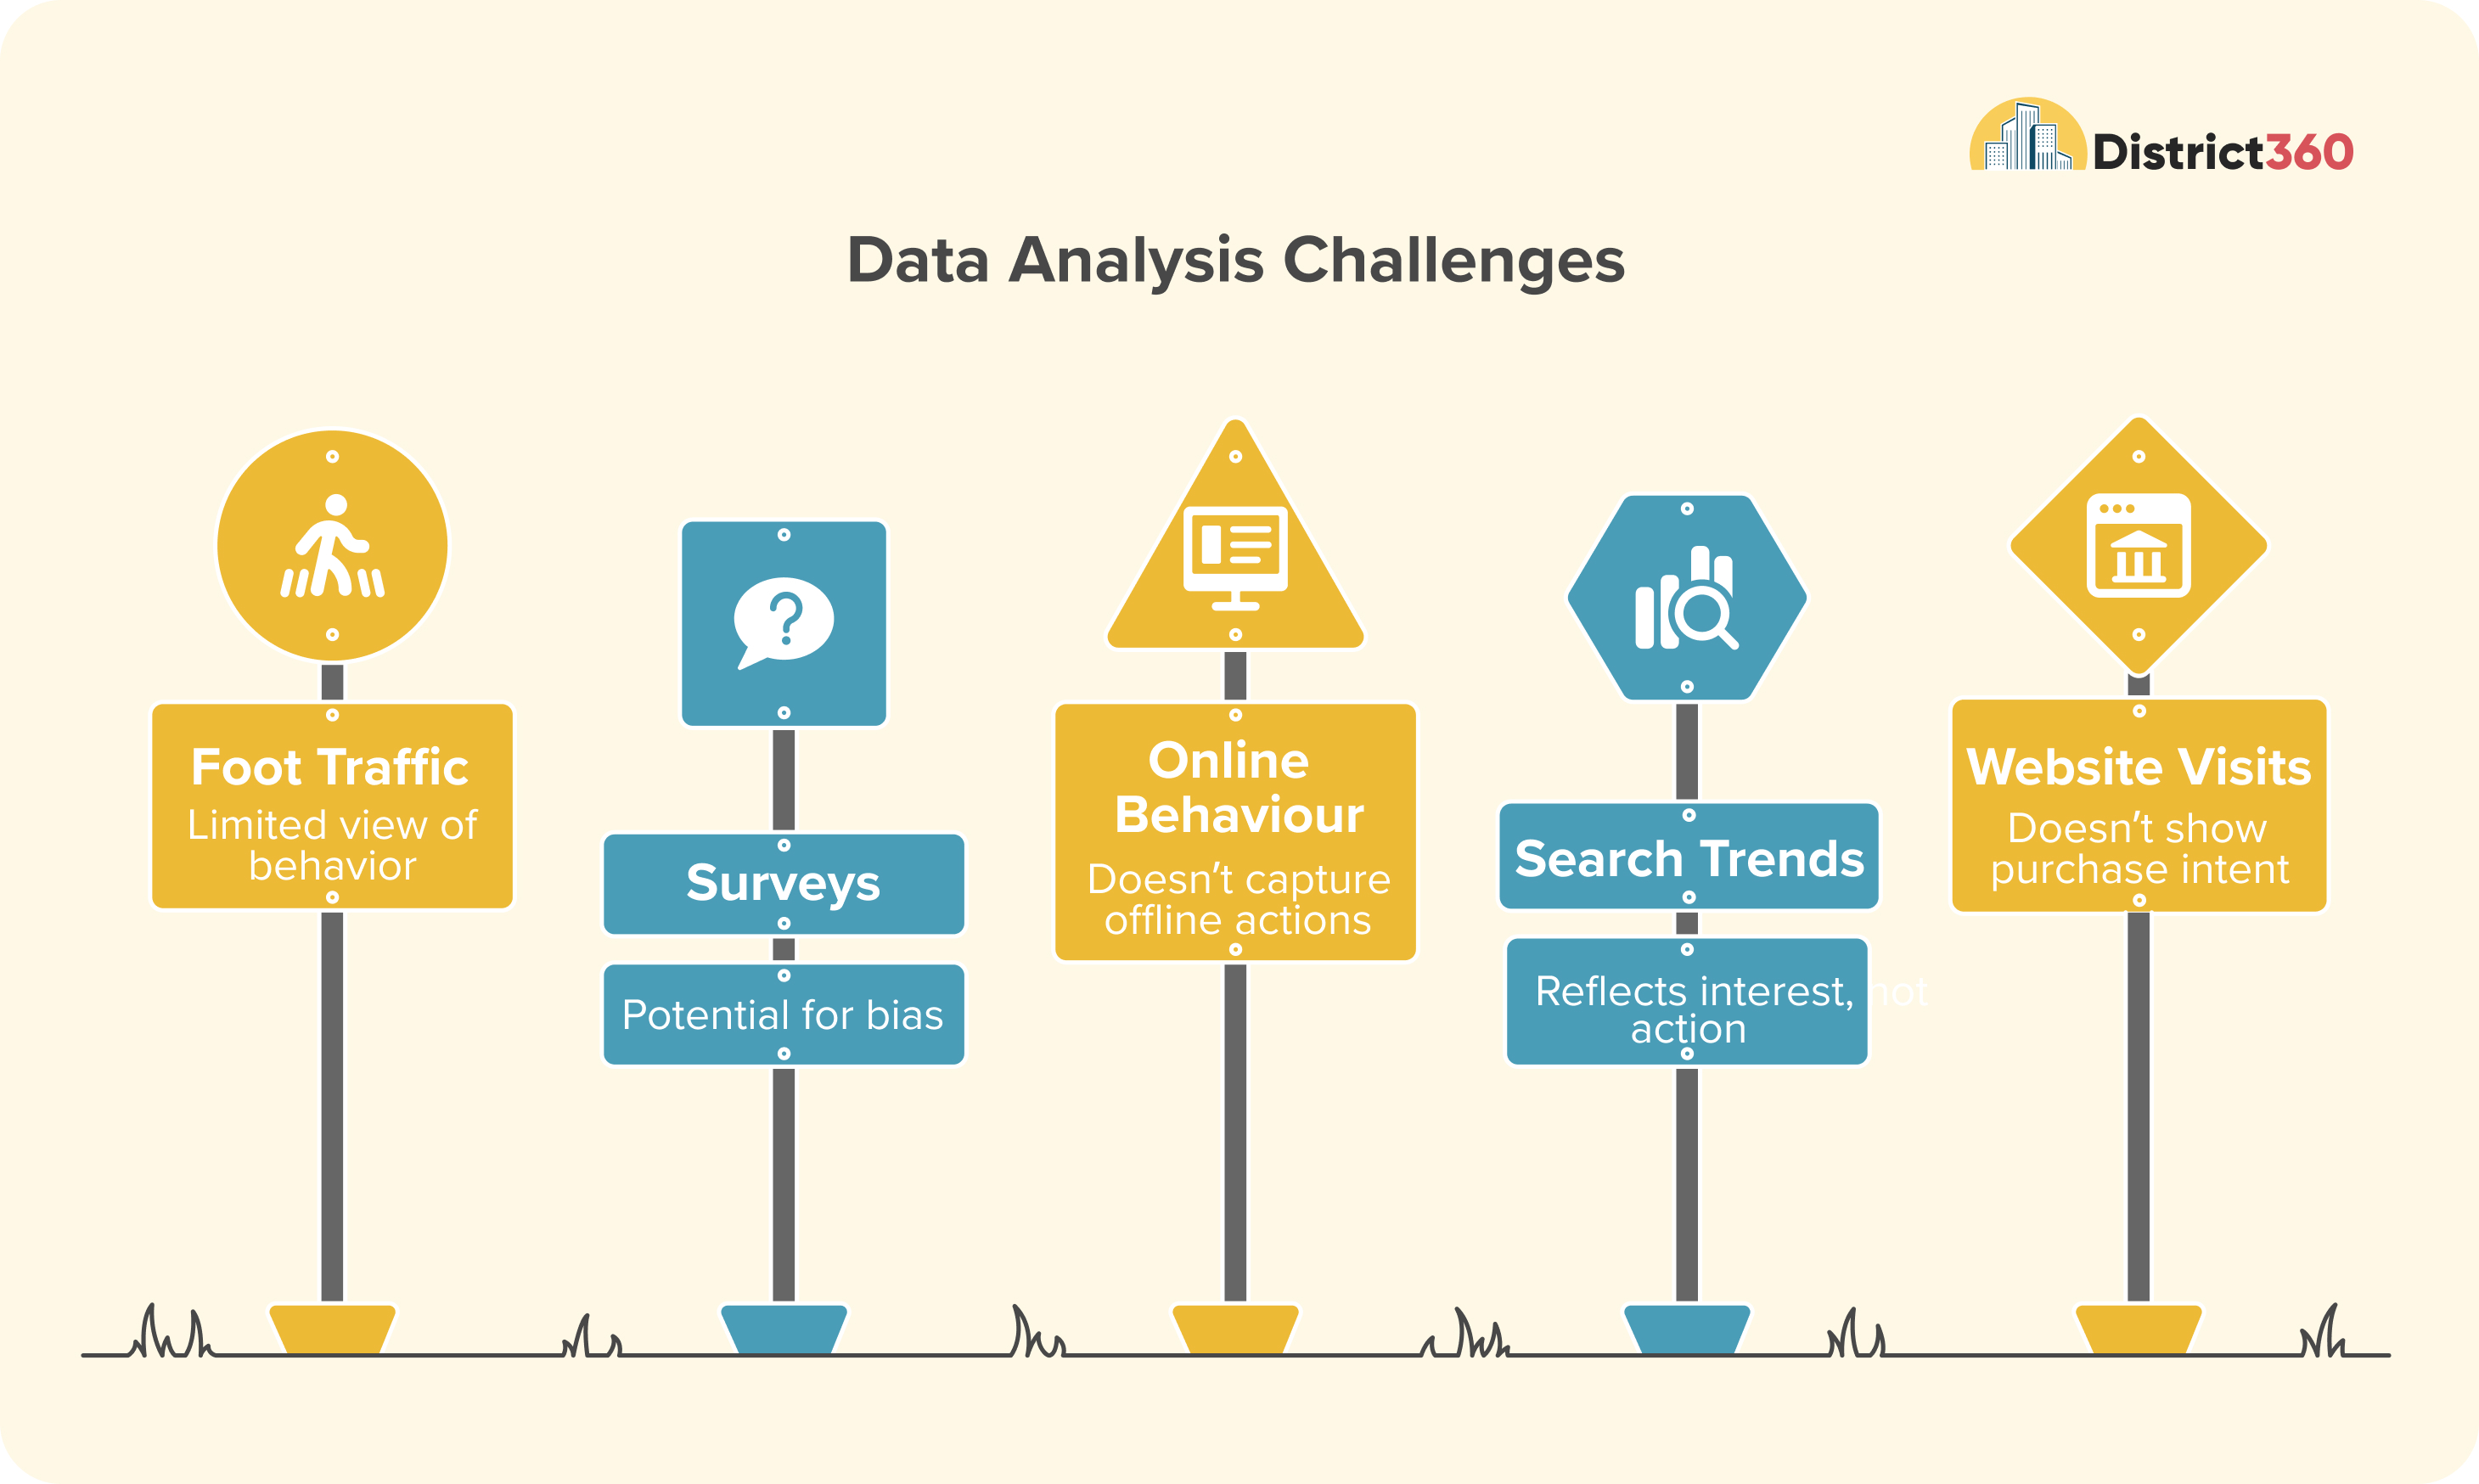
There was also a shift in how people are thinking about data more broadly. Instead of relying on a single metric to tell the whole story, there is a growing push to look at multiple signals at the same time.
Foot traffic, surveys, online behavior, even things like search trends or website visits.
None of them is perfect on their own, but when they all start pointing in a similar direction, it becomes easier to build a more complete picture of what is happening.
The Practical Challenges Are Still There
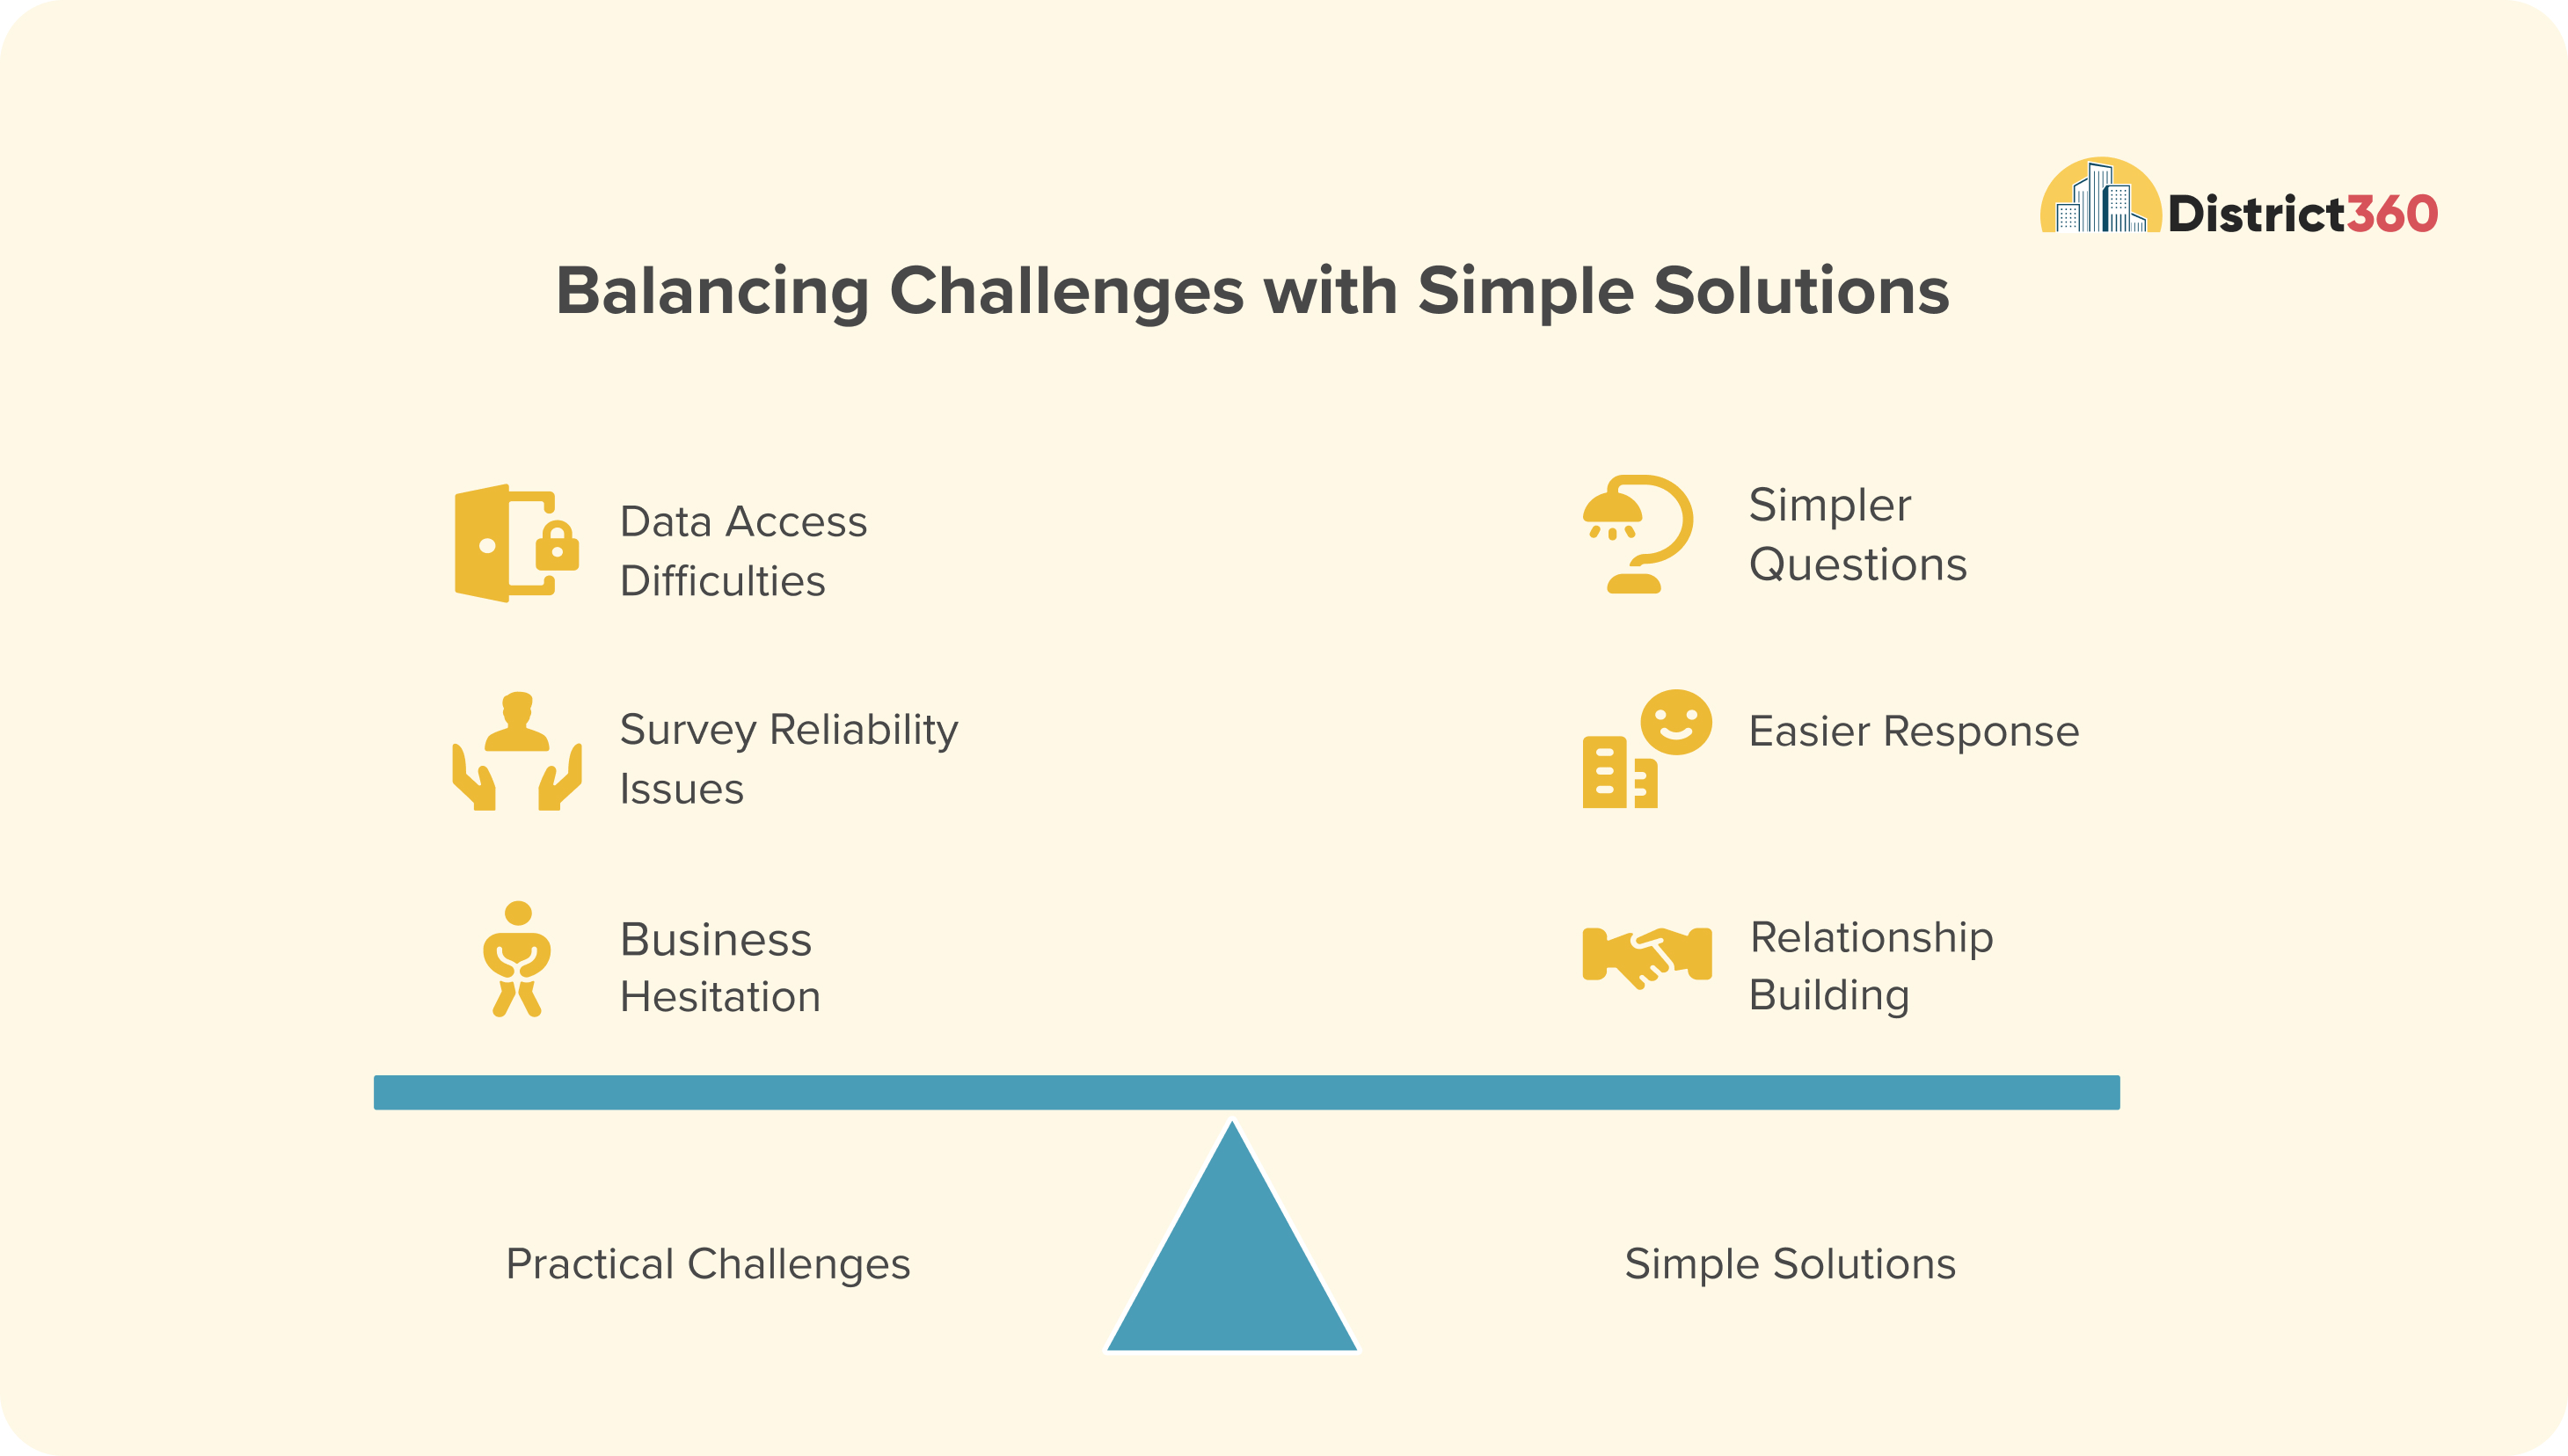
At the same time, the challenges are very real. Like spending data is hard to access and often expensive, surveys rely on people reporting things themselves, and businesses are often hesitant to share their numbers.
So a lot of what is actually working right now is not complicated. Asking simpler questions. Making it easier for people to respond. Letting businesses know in advance that you will be following up. And in many cases, just building relationships so that people are more willing to share information.
Where This Leaves Us
If there is one thing this session made clear, it is that the work is not just in collecting data, it is in explaining it.
Because numbers do not speak for themselves. They need context, they need explanation, and they need to be part of a larger story that people can understand.
If you are working through this in your own district, you are not alone in it. Most teams are somewhere in the middle of this process, figuring it out step by step.

Want to Explore This Further?
This was the second part of our roundtable series, in which we moved from measuring perception to understanding how to communicate impact.
You can watch the first session here and the second session here. If you want to go deeper on this, Josh Yeager from Bright Brothers has put together a really thoughtful white paper on this topic that’s worth a read.
And if you are thinking through how to approach this in your own downtown, feel free to reach out. We would be happy to share what we are seeing across other districts.
See District360 in Action
- Local Success Stories
- Tailored Use Cases
- Integration & Migration Synergies